Air quality in Puyang
Air quality index (AQI) and PM2.5 air pollution in Puyang
4.1K people follow this city

Puyang Air Quality Map
Real-time Puyang air pollution map
Weather
What is the current weather in Puyang?
| Weather | Rain |
| Temperature | 78.8°F |
| Humidity | 43% |
| Wind | 8.8 mp/h |
| Pressure | 29.7 Hg |
live aqi city ranking
Real-time China city ranking
| # | city | US AQI |
|---|---|---|
| 1 |  Bayan Nur, Inner Mongolia Bayan Nur, Inner Mongolia | 565 |
| 2 |  Hohhot, Inner Mongolia Hohhot, Inner Mongolia | 559 |
| 3 |  Baotou, Inner Mongolia Baotou, Inner Mongolia | 452 |
| 4 |  Wuhai, Inner Mongolia Wuhai, Inner Mongolia | 394 |
| 5 |  Wuda, Inner Mongolia Wuda, Inner Mongolia | 351 |
| 6 |  Shizuishan, Ningxia Shizuishan, Ningxia | 302 |
| 7 |  Jiayuguan, Gansu Jiayuguan, Gansu | 213 |
| 8 |  Alxa League, Inner Mongolia Alxa League, Inner Mongolia | 185 |
| 9 |  Jieyang, Guangdong Jieyang, Guangdong | 178 |
| 10 |  Jinchang, Gansu Jinchang, Gansu | 172 |
(local time)
SEE WORLD AQI RANKING3D animated air pollution map

live Puyang aqi ranking
Real-time Puyang air quality ranking
| # | station | US AQI |
|---|---|---|
| 1 | Kaixuan Road Primary School | 90 |
| 2 | Oilfield geophysical company | 88 |
| 3 | Environmental Protection Agency | 84 |
| 4 | Oilfield transportation company | 84 |
(local time)
SEE WORLD AQI RANKINGUS AQI
86
live AQI index
Moderate
Overview
What is the current air quality in Puyang?
| Air pollution level | Air quality index | Main pollutant |
|---|---|---|
| Moderate | 86 US AQI | PM2.5 |
| Pollutants | Concentration | |
|---|---|---|
| PM2.5 | 28µg/m³ | |
| PM10 | 65.5µg/m³ | |
| O3 | 92.5µg/m³ | |
| NO2 | 11µg/m³ | |
| SO2 | 9.5µg/m³ | |
| CO | 350µg/m³ | |
PM2.5
x5.6
PM2.5 concentration in Puyang is currently 5.6 times the WHO annual air quality guideline value
Health Recommendations
What is the current air quality in Puyang?
| Sensitive groups should reduce outdoor exercise | |
| Close your windows to avoid dirty outdoor air GET A MONITOR | |
| Sensitive groups should wear a mask outdoors GET A MASK | |
| Sensitive groups should run an air purifier GET AN AIR PURIFIER |
Forecast
Puyang air quality index (AQI) forecast
| Day | Pollution level | Weather | Temperature | Wind |
|---|---|---|---|---|
| Thursday, May 16 | Moderate 71 AQI US | 91.4° 57.2° | ||
| Friday, May 17 | Unhealthy for sensitive groups 114 AQI US | 100.4° 66.2° | ||
| Saturday, May 18 | Unhealthy for sensitive groups 108 AQI US | 104° 71.6° | ||
| Today | Moderate 86 AQI US | 104° 71.6° | ||
| Monday, May 20 | Unhealthy for sensitive groups 122 AQI US | 100.4° 77° | ||
| Tuesday, May 21 | Unhealthy 158 AQI US | 82.4° 66.2° | ||
| Wednesday, May 22 | Unhealthy for sensitive groups 140 AQI US | 96.8° 66.2° | ||
| Thursday, May 23 | Unhealthy for sensitive groups 113 AQI US | 98.6° 69.8° | ||
| Friday, May 24 | Unhealthy for sensitive groups 111 AQI US | 100.4° 71.6° | ||
| Saturday, May 25 | Unhealthy for sensitive groups 132 AQI US | 100.4° 73.4° |
Interested in hourly forecast? Get the app
How to best protect from air pollution?
AIR QUALITY ANALYSIS AND STATISTICS FOR Puyang
What is the air pollution in Puyang?
Puyang is a prefecture-level city in north-eastern Henan province in China. It is located on the northern shore of the Yellow River and borders Anyang to the west, Xinxiang to the southwest, and the provinces of Shandong and Hebei to the east and north respectively. A Chinese prefecture-level city means that it administers a district and some counties. In this case, Puyang administers 1 district and 5 counties.
In 2019, the estimated population was just over 3.5 million residents spread over 850 square kilometres.
In the second quarter of 2021, Puyang was experiencing a period of “Unhealthy” air with a US AQI reading of 176. This classification is in line with the recommendations from the World Health Organisation (WHO). The concentrations of the six main pollutants were as follows: PM2.5 - 103 µg/m³, PM10 - 103 µg/m³, ozone (O3) - 64 µg/m³, nitrogen dioxide (NO2) - 38.5 µg/m³, sulphur dioxide (SO2) - 15.5 µg/m³ and carbon monoxide (CO) - 800 µg/m³.
With levels such as these, it is advisable to close doors and windows to prevent the ingress of dirty air into the rooms. All types of outdoor activity should be postponed until the air quality improves, but if it is unavoidable to venture outside, then a good quality mask should be worn at all times. If an air purifier is available, it would be very beneficial to use it during these times.
Does the level of air pollution in Puyang vary throughout the year?
Having studied the newly released figures for 2020 on the IQAir website, it is clear that the worst months for air pollution in Puyang are during the autumn and winter. The beginning of October until the end of February recorded “Unhealthy” levels of air quality with figures between 55.5 and 150.4 µg/m³. March and April appeared to be transitional months when the quality was “Unhealthy for sensitive groups” with figures between 35.5 and 55.4 µg/m³. The remaining 5 months from May until the end of September saw a relatively “Moderate” period when readings were from 12.1 to 35.4 µg/m³.
Looking back over records from previous years it can be seen that the level of air quality is slowly improving. In 2017 the level was 68.8 µg/m³ falling to 63.5 µg/m³ during the following year. For 2019 the level saw no real movement one way or the other with a level of 63.4 µg/m³. However, in 2020 the figure showed quite an improvement at 59.3 µg/m³ but this could be due to the reduction of traffic and industry due to the COVID-19 pandemic. It will be interesting to see what the levels are for 2021 to see if the quality is still improving.
What are the sources of Puyang’s polluted air?
Air pollution may be generated locally, but it can spread over long distances, sometimes across continents through international weather patterns.
The main source of household air pollution is the burning of fossil fuels, wood and other biomass fuels indoors for cooking, heating and lighting. Every year, about 3.8 million people die prematurely due to indoor air pollution, the vast majority of which occur in developing countries.
Out of 193 countries, 97 countries have increased the proportion of households with cleaner fuels to more than 85 per cent. However, 3 billion people continue to use solid fuels and open flames for cooking, heating and lighting. Using cleaner and more modern stoves and fuels can reduce the risk of illness and save lives.
In many countries, energy production is the main source of air pollution. Coal-fired power stations are the main cause of air pollution, and diesel generators are increasingly worrying in off-grid areas. In the chemical and mining industries, industrial processes and the use of solvents also pollute the air.
The global transportation sector accounts for nearly a quarter of energy-related carbon dioxide emissions, and this number is rising. Emissions from the transportation sector have been linked to the premature deaths of nearly 400,000 people. Nearly half of deaths caused by pollution in the transportation sector are caused by diesel emissions, and those who live closest to major transportation routes are 12 per cent more likely to be diagnosed with dementia.
Reducing vehicle emissions is an important measure to improve air quality, especially in urban areas. Policies and standards that require the use of cleaner fuels and advanced vehicle emission standards can reduce vehicle emissions by 90 per cent or more.
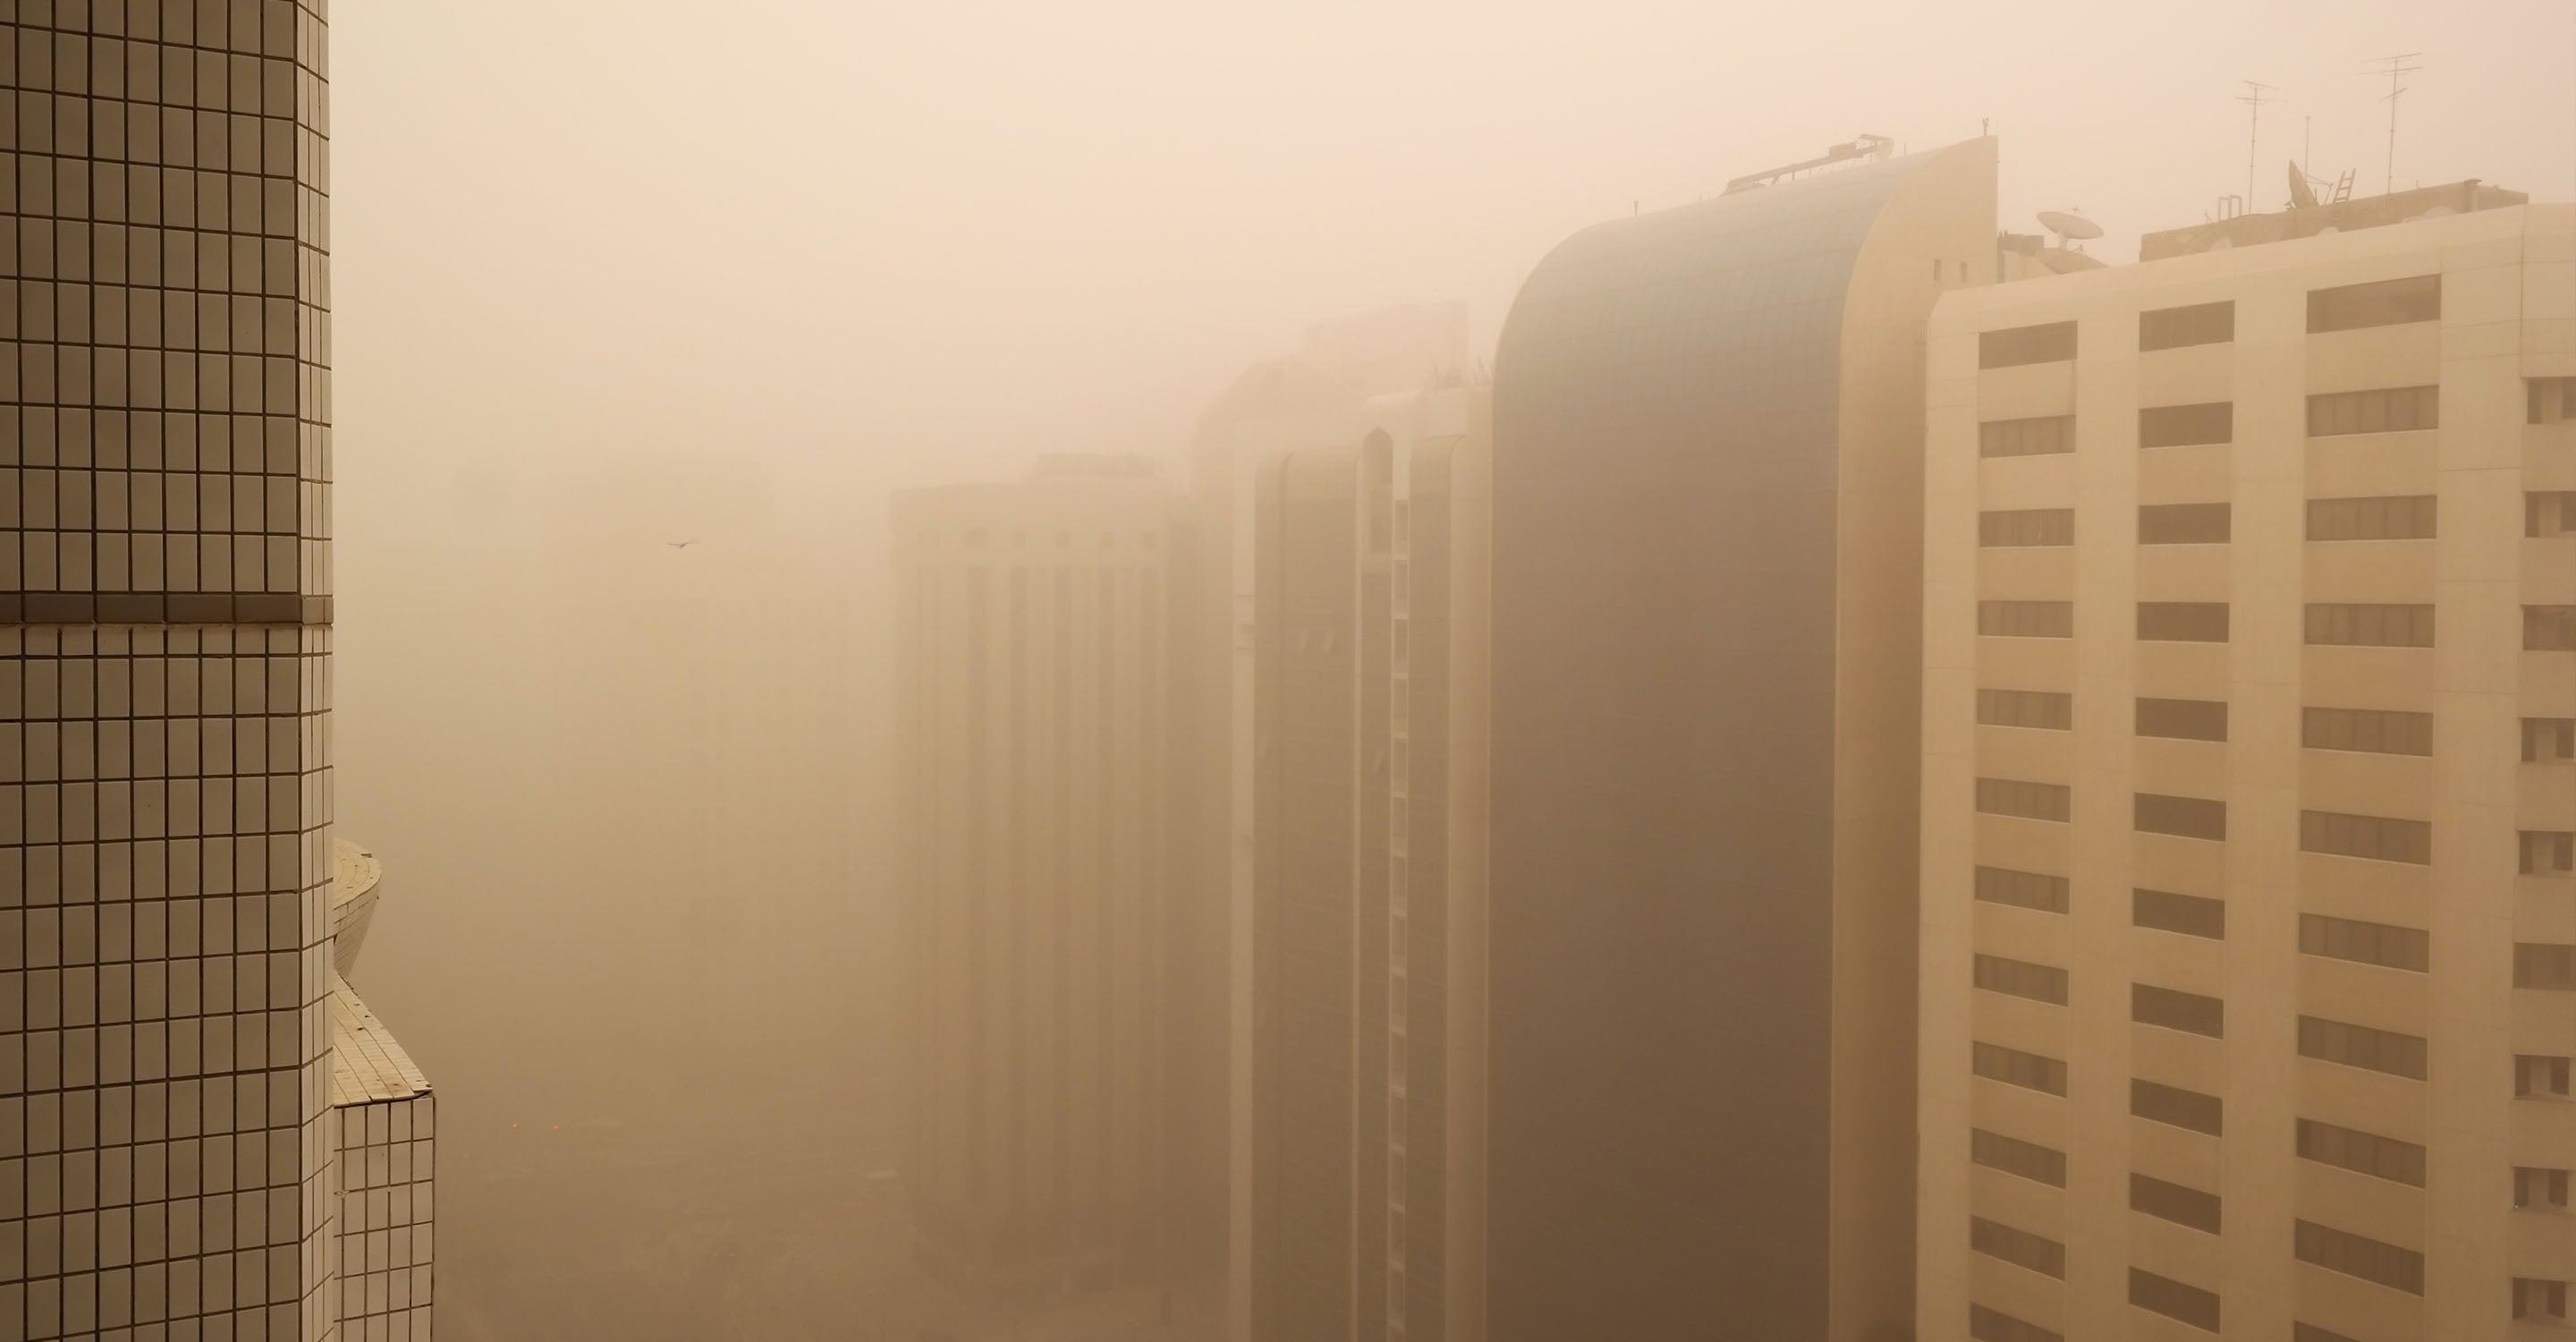
Not all air pollution comes from human activities. Volcanic eruptions, sandstorms, and other natural processes can also cause problems. Sandstorms are particularly worrying. The fine dust particles that follow sandstorms can travel thousands of miles, and sandstorms may also carry pathogens and harmful substances, causing acute and chronic respiratory diseases.
Can anything be done to improve the air quality in Puyang?
When heavy-duty construction vehicles pass by on urban roads, the dust permeated behind is like a thick fog that cannot dissipate for a long time, and pedestrians on the road have become "vacuum cleaners." It can be said that fugitive dust has become one of the main causes of atmospheric pollution and increased haze weather.
From the end of June to 31st December, the city monitored 41 dusty road sections, 324 construction sites, 22 road construction sites and 49 municipal construction sites reported by various departments at all levels in the city. Limits have been set and agreed upon and these limits must be strictly adhered to. The limit for PM10 will be 111 µg/m³ and PM2.5 will be limited to 76 µg/m³. The number of days will also be monitored to ensure that at least 190 days are classified as having acceptable levels of air quality.
What are the consequences to health by breathing in polluted air?
The pollutant that affects people the most is particulate matter, usually abbreviated as PM and used as a measure of air pollution. Although particles with a diameter of 10 microns or less (≤PM10 ) can penetrate and embed deeply in the lungs, the ones that are more detrimental to health are those with a diameter of 2.5 microns or less (≤PM2.5 ). These particles are very small, only one 60th of the diameter of a human hair.
PM2.5 can enter the bloodstream through the lung barrier. Long-term exposure to these particles may increase the risk of cardiovascular and respiratory diseases, as well as lung cancer.
Ozone is a major factor in causing asthma (or making the condition worse). Nitrogen dioxide and sulphur dioxide can also cause asthma, bronchial symptoms, lung inflammation and decreased lung function.


